
What’s in this article
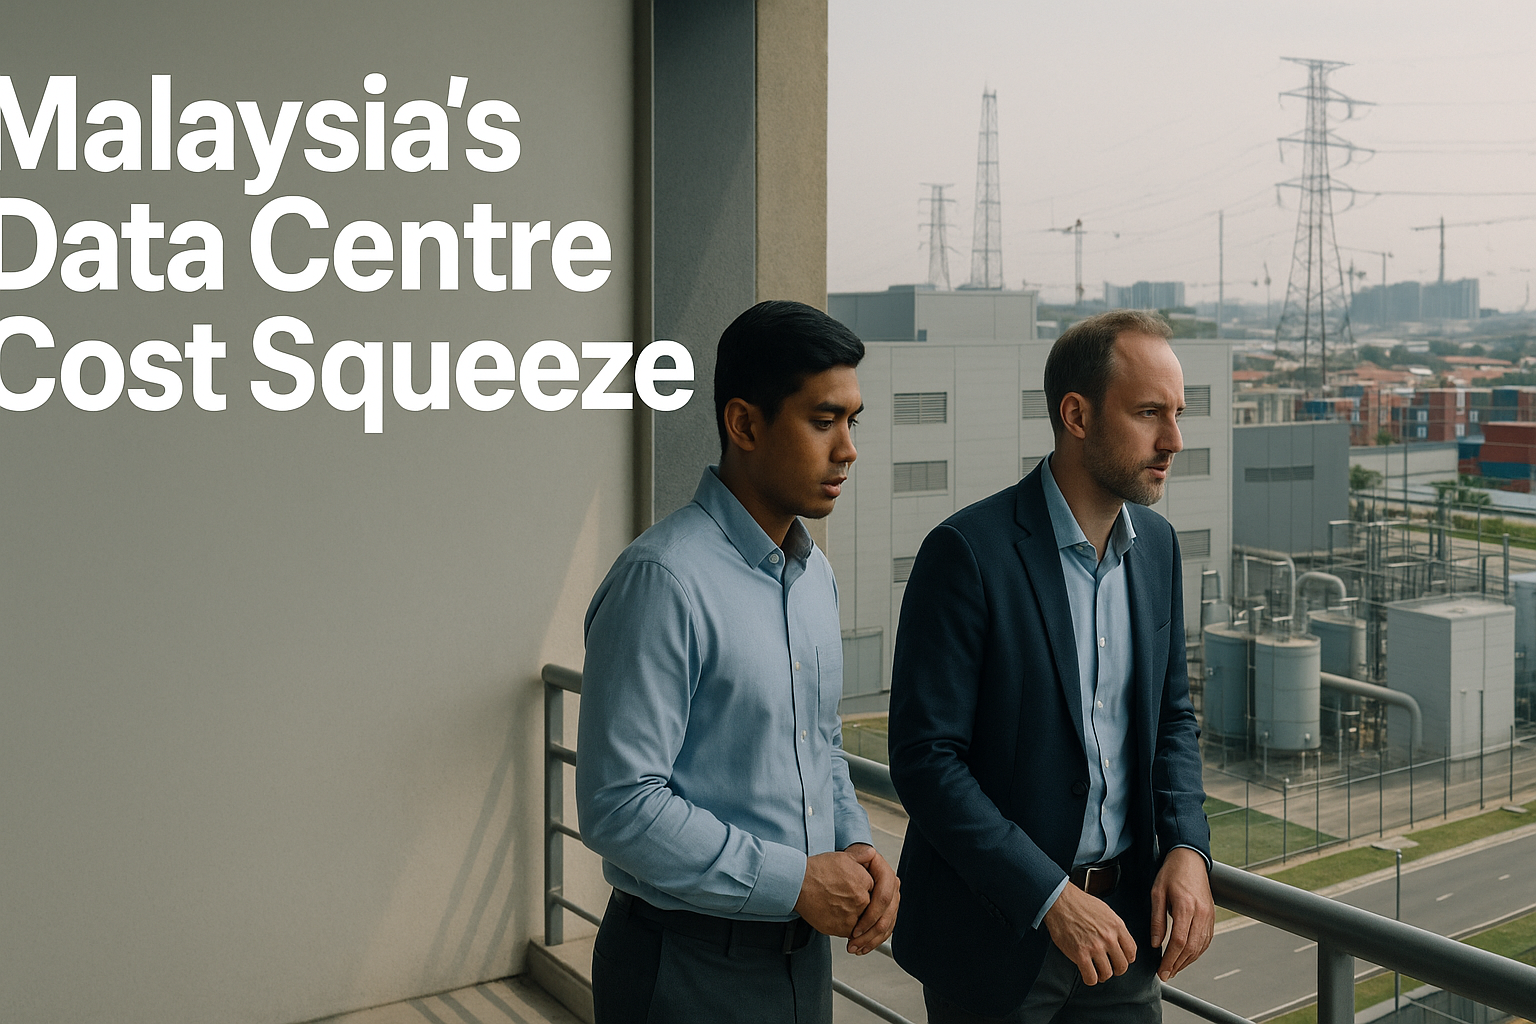
The Malaysia data centre boom is reshaping costs far beyond the tech sector. As builds concentrate around Johor, the Klang Valley, and key industrial corridors, SMEs are already feeling the knock-on effects: tighter industrial space, longer lead times for power connections, more scrutiny on water reliability, and higher risk premiums in leases and insurance. For management teams, this is not a headline—it is a budgeting problem with contract deadlines. If you wait until 2027 constraints are obvious, you may be renegotiating from a weak position.
This guide is a CFO-grade playbook to quantify exposure (rent, utilities, fit-out, backup power, and operational friction), compare location options, and take practical actions now—renegotiating lease and utility terms, redesigning footprint and load, and funding energy-efficiency moves that protect margins.
What costs typically move first when data-centre capacity expands in your corridor?
Most SMEs expect “rent goes up”. In practice, the first-order impacts are a cost stack, and different items move on different timelines.
The SME cost stack impact map (what to model)
Use this as a budgeting template when you review sites or renew contracts:
1.Industrial rent and land values
- Higher asking rents for newer stock near substations, fibre routes, and major highways.
- More aggressive escalation clauses and shorter incentive periods
2. Service charges and building operating costs (even in industrial parks)
- Common area maintenance, security, and utilities pass-throughs can rise when parks upgrade infrastructure.
3. Fit-out and electrical works
- Heavier distribution boards, cabling, power factor correction, and metering.
- Longer lead times for contractors and switchgear.
4. Power availability as a binding constraint
- Not just the tariff; the ability to secure capacity and the time to connect can drive schedule and cashflow.
5. Water reliability and process water cost (where relevant)
- Particularly important for food processing, cleaning-intensive operations, and some manufacturing.
6. Insurance and business interruption exposure
- Premiums can reflect perceived grid instability, flood risk, and single-site dependency.
7. Logistics friction and delay costs
- Congestion on key routes increases buffer inventory needs, driver time, and missed delivery penalties.
8. Labour commute/time cost
- If your move pushes staff further from affordable housing or public transport nodes, retention and overtime rise.
Practical takeaway
Model each item separately. A 6–10% rent increase can be less damaging than a three-month delay in energising a site, or demand-charge exposure you did not anticipate. The goal is not perfect forecasting; it is avoiding “unbudgeted constraints” that force expensive last-minute decisions.
How do Johor and the Klang Valley differ in cost pressure and constraint risk?
Treat “Malaysia” as multiple operating theatres. Your cost and risk profile changes materially by corridor.
Johor: capacity narrative, but site readiness becomes the bottleneck
Johor’s data-centre concentration can pull demand toward specific zones and parks.
Budget and risk items that often dominate:
- Land/industrial rent escalation around well-connected parks and near major transport links.
- Power connection lead times becoming a scheduling risk (plan earlier, document load needs precisely).
- Water and flood resilience: some locations require stronger business continuity planning, depending on micro-location.
- Cross-border logistics patterns: if your supply chain relies on Singapore-linked flows, factor in variability and buffer stock.
Where Johor can still work well:
- If your process can accept slightly longer commissioning timelines but benefits from space availability and logistics positioning.
Klang Valley: demand density and competition for “ready” sites
Klang Valley decisions tend to be driven by time-to-operate and access to workforce and customers.
Budget and risk items that often dominate:
- Higher base rent for modern, compliant industrial stock.
- Upgrades and retrofits: older premises can require heavier spend to reach your electrical, safety, and operational standards.
- Traffic and driver time: logistics cost per delivery often rises through congestion effects.
- Power quality and resilience planning: not because the grid is “bad”, but because the cost of downtime is higher in dense operating environments.
Key corridors (Port access, highway nodes, established parks)
In both regions, specific corridors price differently:
- Closer to port/airport/highway nodes: higher rent, but lower delivery variability.
- Deeper inland: lower rent, but higher hidden logistics and staffing costs.
Practical takeaway
Do a two-layer comparison:
- Corridor economics (rent, labour access, logistics).
- Utility readiness (capacity, connection timeline, resilience).
A lower-rent site that delays energisation can be more expensive than a higher-rent site that starts revenue earlier.
How do you quantify power as a strategic variable (not a fixed overhead)?
For many SMEs, electricity has been treated as a predictable monthly bill. Under infrastructure pressure, power becomes a planning variable that affects site choice, capex, and customer commitments.
Build a power profile for your business (one page)
Create a simple load and risk profile you can share with landlords, contractors, and the utility process:
- Connected load (kW) vs maximum demand (kW)
- Load shape (when peaks occur: morning start-up, afternoon heat, batch cycles)
- Critical loads (what must stay on during an outage)
- Tolerance for curtailment (can you shift production hours?)
- Power quality sensitivity (voltage dips matter for CNC, cold chain, servers, QA labs)
If you do not know these numbers, you will overpay—either through overbuilding electrical infrastructure or through repeated operational disruptions.
Don’t budget only for tariffs—budget for demand exposure
Even without predicting future tariffs, you can manage the structure of your exposure:
- Maximum demand / demand charges: peak spikes can dominate bills for motor-heavy operations.
- Power factor penalties: avoidable with proper correction equipment and monitoring.
- Downtime cost: quantify lost margin per hour, spoilage, restart waste, and delivery penalties.
Connection timeline risk is a financing risk
If energisation slips, you may carry:
- idle rent and service charges
- staff hired but underutilised
- equipment depreciation without output
- delayed customer onboarding
Treat connection readiness as a gating item in your capex plan. Build contingencies into contracts and cashflow.
Practical takeaway
Power is not “utilities”. It is capacity + reliability + pricing structure + timeline. Put it in your site selection scorecard with the same weight as rent.
What should your 2026–2027 cost model look like for rent, fit-out, and operating overheads?
SMEs often use last year’s cost base plus a small inflation factor. That approach fails when you face step-changes in lease terms, fit-out needs, and utility exposure.
A practical model structure (that finance teams actually maintain)
Build a three-scenario model for each shortlisted site or renewal option:
Scenario A: “Base renewal / base move”
- Current operating pattern, minimal retrofit.
Scenario B: “Constraint case”
- Rent escalates faster than expected.
- Power connection delayed.
- Higher capex for electrical works.
Scenario C: “Mitigation case”
- You invest in energy efficiency + peak shaving.
- You renegotiate escalation and expansion options.
- You redesign footprint (storage, shifts, layout).
What to include (beyond obvious rent)
- Rent + escalation + service charges (show separately)
- Fit-out capex: electrical, HVAC, compressed air, racking, safety systems
- Commissioning timeline costs: double rent, temporary operations, staged move
- Backup power: generator/UPS, maintenance, fuel logistics (if needed)
- Insurance premium changes (including business interruption)
- Logistics: route time, fleet size, 3PL surcharges, buffer inventory
- People costs: shift allowances, overtime, turnover risk, transport subsidies
Metrics that help decision-making
- Cost per unit output (or cost per shipment / per order)
- Downtime-at-risk hours × margin per hour
- Cash conversion impact from increased buffer stock
- Payback period for efficiency capex (use conservative savings assumptions)
Practical takeaway
If you cannot explain the cost difference between two sites in three drivers (e.g., rent escalation, demand peaks, and logistics variability), your model is missing the real levers.
How can SMEs renegotiate industrial leases to protect against rent escalation and site risk?
A lease is not just a rent number. It is an operating contract that can either protect cashflow—or lock you into rising costs with limited flexibility.
Clauses to focus on (commercial, not legalistic)
When renewing or signing a long-term industrial lease, consider negotiating around these levers:
1) Escalation structure
- Prefer clear, capped step-ups over open-ended mechanisms you cannot forecast.
- If the landlord insists on a benchmark-linked increase, negotiate caps/floors and require transparent calculation.
2) Renewal options and notice windows
- Secure option periods that you control, with enough lead time to plan utilities and fit-out.
3) Expansion flexibility
- Right of first refusal on adjacent space, or pre-agreed expansion terms.
- If not possible, at least negotiate early exit / subletting rights (subject to landlord approval) to reduce “growth penalty”.
4) Service charge transparency
- Define what is pass-through vs landlord responsibility.
- Ask for budgeting visibility and limits on discretionary upgrades.
5) Site readiness and handover conditions
- Document the condition and capacity you are taking over (power capacity, loading bays, roof condition, drainage).
- Tie any landlord works to timelines and remedies.
6) Business continuity and outage responsibilities
- Clarify what the landlord must maintain (e.g., park infrastructure) and how outages are communicated.
A practical negotiation sequence
- Bring a one-page operational profile (power, water needs, operating hours, loading).
- Show your investment plan (fit-out, equipment). Landlords respond to credible, long-term tenants.
- Trade terms, not just price: you may accept slightly higher rent for better expansion rights or capex contributions.
- Lock decision timing: align lease milestones with utility application and fit-out lead times.
Practical takeaway
Aim to buy three things in the lease: cost predictability, time-to-operate certainty, and flexibility to scale or exit. Rent is only one component.

How do you structure utility arrangements and contingency plans without overbuilding expensive redundancy?
SMEs can overreact by buying heavy backup systems that never pay back—or underreact and absorb repeated disruption costs. The balanced approach is to match contingency spending to quantified downtime impact.
Step 1: Define “critical loads” and “acceptable downtime”
Split operations into tiers:
- Tier 1 (must run): servers, essential safety systems, cold storage, critical QA instruments.
- Tier 2 (should run): core production line that drives daily revenue.
- Tier 3 (can pause): batch steps that can shift to nights/weekends.
Assign each tier an acceptable downtime and the business cost per hour.
Step 2: Choose the right resilience pattern
Options to consider (often combined):
- UPS for Tier 1 (short runtime, protects against dips and brief outages)
- Generator for Tier 1–2 (if downtime costs justify it)
- Process redesign (manual fallback, buffer tanks, staged restart procedures)
- Inventory buffers for critical inputs/outputs
- Multi-site strategy (for some businesses, a small secondary site beats heavy redundancy in one site)
Step 3: Put “operability” into contracts and SOPs
- Maintenance schedules and testing routines for backup systems
- Fuel supply and refuelling plan
- Clear restart procedures to reduce scrap and damage
- Named owners and monthly checks
Practical takeaway
Resilience is not a one-time capex decision. It is an operating system: defined loads, tested equipment, and trained staff. Spend where downtime cost is real and measurable.
Which energy-efficiency moves typically pay back fastest under Malaysia operating conditions?
Energy efficiency is one of the few levers SMEs can control regardless of rent cycles and corridor congestion. The goal is not “green branding”; it is margin protection and capacity relief.
Start with measurement (before you buy equipment)
You do not need an enterprise platform to start:
- Install sub-metering on major loads (HVAC, compressed air, key lines).
- Track daily peak demand and weekly load shape.
- Create a simple dashboard: kWh/unit, peak kW, downtime events.
Quick wins that often deliver credible ROI
(Actual results vary; validate with your own data and supplier quotes.)
1) HVAC optimisation (offices, labs, mixed-use sites)
- Setpoint discipline, maintenance, and zoning.
- Address infiltration and insulation before upgrading equipment.
2) Motors and drives (manufacturing)
- Variable speed drives (VSDs) on variable-load pumps/fans.
- Fix alignment, lubrication, and oversized motors.
3) Compressed air (common hidden cost)
- Leak detection and repair routines.
- Lower pressure setpoints where possible.
- Improve dryer and receiver sizing.
4) Lighting
- LED + controls in warehouses and yards.
5) Peak shaving and load shifting
- Stagger start-up of high-load equipment.
- Move non-critical batch operations off peak where feasible.
- Use thermal storage strategies in some cooling-heavy setups.
Capex prioritisation: a simple rule
Prioritise projects that do at least one of the following:
- reduce peak demand (not just kWh)
- remove a reliability risk (overheating, nuisance trips)
- defer an electrical upgrade you would otherwise need
Practical takeaway
Treat efficiency as a portfolio: low-cost operational fixes first, then targeted capex backed by measured baselines. The win is not only lower bills; it is lower peak exposure and more predictable operations.
How should you redesign footprint and operations if rent and utilities rise together?
If both rent and power pressure increase, “move or pay” is not your only choice. Many SMEs can re-architect space and operations to protect unit economics.
Footprint redesign options (practical examples)
- Vertical racking + tighter slotting to reduce warehouse area per pallet.
- Cross-dock or hybrid fulfilment to lower storage needs if your demand pattern allows.
- Split-site model: keep customer-facing or light assembly near Klang Valley; put bulk storage or non-time-sensitive steps in a lower-cost corridor.
- Shift redesign: extend operating hours to reduce peak demand and improve asset utilisation.
Don’t ignore “people logistics”
A redesign that saves rent but increases staff turnover can backfire. Model:
- commute time impact by shift
- hiring pool access
- transport cost or allowances
Implementation sequence that reduces disruption
- Map current flows (receiving → storage → production → dispatch).
- Identify bottlenecks and high-cost metres (space, kW peaks, forklift travel).
- Pilot one zone (one line or one aisle) before full re-layout.
- Update SOPs, safety markings, and training—layout changes create incident risk.
- Re-baseline KPIs after 4–6 weeks (pick rate, spoilage, energy peaks).
Practical takeaway
Space is a cost. But it is also a throughput engine. Redesign decisions should be tested against throughput, safety, and staffing—not just rent per square foot.
What’s a practical 90-day action plan to get ahead of 2027 constraints?
You do not need a perfect forecast. You need a disciplined set of actions that moves you into stronger negotiating and budgeting positions.
Days 1–30: Build your “cost and constraint dossier”
Owner: CFO/Finance lead with Operations
- Create the cost stack map for your current site (rent, service charges, power profile, water, logistics, insurance).
- Document load profile (peaks, critical loads) and downtime cost per hour.
- List upcoming contract cliffs: lease expiry, rental review dates, major equipment replacements.
Deliverable: a 2–3 page pack you can use in negotiations.
Days 31–60: Run site and contract options in parallel
Owner: Operations + Finance + Procurement
- Shortlist 2–3 location options (including “stay and renegotiate”).
- Request written clarifications on site readiness and typical connection timelines (avoid informal assumptions).
- Draft a lease position: escalation caps, renewal options, expansion rights, service charge transparency.
- Build a three-scenario model (base / constraint / mitigation).
Days 61–90: Lock near-term savings and de-risk timelines
Owner: GM/COO with Finance
- Execute quick-win efficiency projects with measurement.
- Decide on contingency pattern (UPS/generator/process redesign) based on downtime economics.
- Align capex timing with lease milestones and utility readiness.
Where an advisory partner can help (without turning this into a “project”)
Paul Hype Page & Co. can support management teams as an implementation partner for the finance and operating system: building the site comparison model, translating operational requirements into contract positions, and setting up budgeting and cost controls that remain usable after the move or renewal. The value is in making decisions auditable, bankable, and executable—not theoretical.
Practical takeaway
The 90-day goal is not to “solve Malaysia infrastructure”. It is to put your business in a position where rent reviews, utility lead times, and capex do not surprise your cashflow in 2027.
Conclusion
Malaysia’s data-centre buildout is a corridor-by-corridor cost shift that affects SMEs through rent escalation, utility capacity and timelines, and higher consequences of downtime. The winning move is to treat power and site readiness as strategic variables, not background overheads. Build a cost stack model, quantify your load and downtime economics, and renegotiate leases and operating terms for predictability and flexibility. Then fund measured energy-efficiency and peak-management projects that reduce both bills and peak exposure. If you act in 2026—before contract cliffs and capacity queues harden—you can protect margins and keep growth plans on schedule into 2027.
FAQs
Johor often prices up in specific zones while power connection lead times and site readiness can become the bottleneck; Klang Valley tends to have higher base rents for modern sites and higher congestion and downtime consequences, so “ready-to-operate” factors weigh more.
Model the full cost stack separately: rent and escalation, service charges, electrical fit-out, power capacity and connection timeline risk, water reliability (if relevant), insurance/business interruption, and logistics and labour friction.
Focus on escalation caps or clear step-ups, renewal options with workable notice windows, expansion or exit/subletting flexibility, service charge transparency, documented handover/site readiness conditions, and outage/maintenance responsibilities.
Create a one-page profile covering connected load vs maximum demand, load shape, critical loads, curtailment tolerance, and power-quality sensitivity, then budget for demand exposure, downtime cost per hour, and connection timeline slippage.
Include service charges, fit-out capex (electrical/HVAC/safety), commissioning delay costs, backup power if justified, insurance changes, logistics variability and buffer stock, and people costs such as overtime and retention impacts.
Related Business Articles


Share This Story, Choose Your Platform!