
What’s in this article
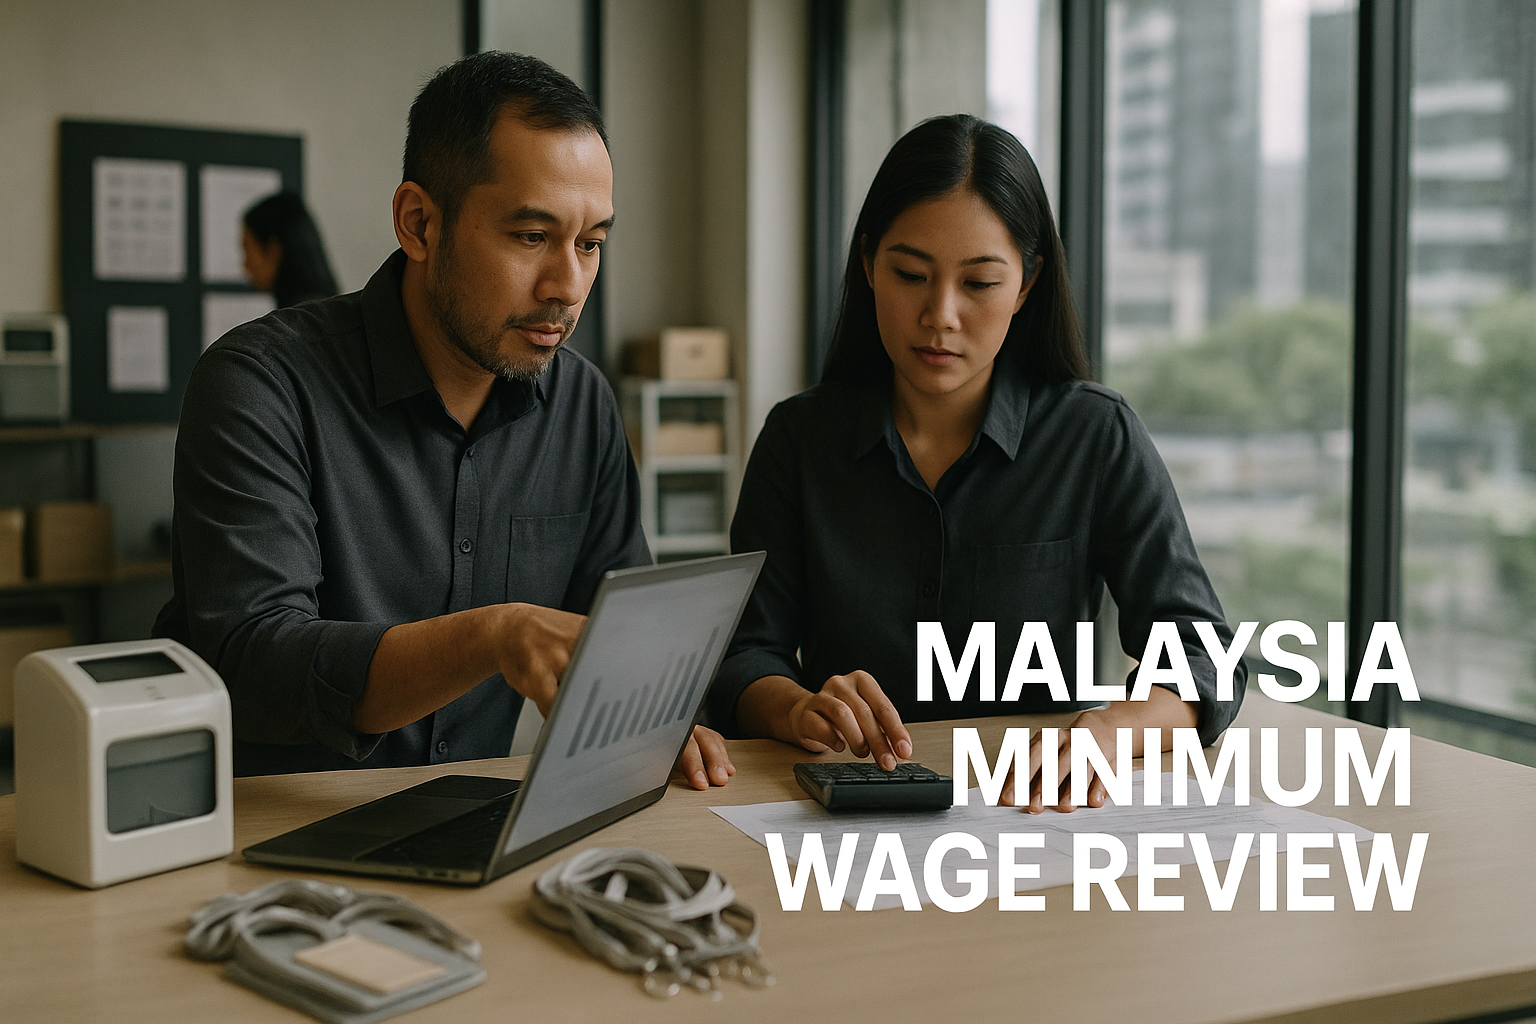
A Malaysia minimum wage review is easy to treat as an HR headline—until it hits your P&L through overtime, allowances, and employer statutory contributions. For many SMEs, the real shock is not the wage floor itself but the fully-loaded cost per hour, the salary compression that forces supervisor adjustments, and the cash-flow strain of a higher payroll run-rate. Updated for Sep 2026 planning, this guide gives you a scenario-based playbook you can run now: build base/upside/downside outcomes (including effective-date timing), quantify total payroll impact (wages + OT + allowances + EPF/SOCSO), pressure-test margins and pricing, and choose operational levers (scheduling, overtime governance, role redesign, output-linked incentives, light automation) before budgets and contracts lock in for 2027.
What numbers should you model first to avoid underestimating the payroll shock?
Start with a model that mirrors how you actually pay people, not a simplified “wage x headcount” table. Your goal is to get to a fully-loaded labour cost per month and per productive hour, by role group.
Build a clean baseline: who is paid what, and how is time used?
Minimum wage changes mostly affect the lower bands, but the cost ripples through the whole wage structure. Build a workforce snapshot:
- Employee list by category: full-time / part-time, permanent / contract (without misclassification), local / foreign (if relevant to your operations), and location (because Selangor policy signals may influence planning).
- Pay components by person or by role group:
- Basic wage
- Fixed allowances (attendance, transport, meal, shift, etc.)
- Variable items (OT, commission, incentives)
- Working pattern: day shift vs multi-shift, typical OT hours, weekend/public holiday exposure, seasonality.
- Productivity proxy: output per headcount hour (orders packed/hour, rooms cleaned/day, calls handled/hour, lines produced/hour). If you don’t have this, estimate it—then improve later.
Convert payroll into “fully-loaded cost per productive hour”
For scenario planning, the most useful unit is: RM per productive hour by role group. A practical starting formula:
- Fully-loaded monthly labour cost =
- Basic wage
- + fixed allowances (those you expect to continue)
- + estimated OT cost (based on recent patterns)
- + employer statutory contributions (e.g., KWSP/EPF and PERKESO/SOCSO, and other payroll items that apply to your workforce)
- + any predictable employer-paid items that rise with wages
Then:
- Fully-loaded cost per productive hour = fully-loaded monthly labour cost ÷ productive hours
“Productive hours” is not always “paid hours.” If breaks, waiting time, and rework are material, estimate an efficiency factor. Even a simple assumption (e.g., 85–90% productive) makes the model more realistic.
Common undercounts to fix early
- OT uplift effect: when the base wage rises, OT and shift premiums can rise mechanically.
- Allowance interactions: some allowances are kept flat; others effectively become part of the market wage. Decide what you assume.
- Statutory contribution impact: employer contributions often rise as wages rise. Don’t add EPF/SOCSO as a footnote; include them in each scenario.
If your baseline is wrong, every downstream decision—pricing, headcount, automation ROI—will be wrong too.
How do you build base, upside, and downside scenarios without guessing the policy?
You’re not trying to predict the announcement. You’re trying to control your decision-making under uncertainty.
Define three scenario variables (keep them simple)
Use three drivers you can adjust quickly:
- Wage floor outcome: low / medium / high increase (don’t anchor on one number).
- Effective date timing: early-year vs mid-year implementation, because timing changes your 2027 cash-flow curve.
- Coverage in your workforce: % of employees currently below the scenario wage floor, plus near-floor employees who are likely to be adjusted for fairness.
Scenario structure that management can use
Create three scenarios that management can discuss in 30 minutes:
- Downside (high impact): higher wage outcome + early effective date + stronger compression adjustments.
- Base (planning case): moderate wage outcome + typical effective date + targeted compression approach.
- Upside (low impact): lower wage outcome + later effective date + minimal compression.
For each scenario, output three numbers:
- Monthly payroll run-rate increase (RM)
- Cost per productive hour increase (RM/hour)
- EBITDA or gross margin sensitivity (e.g., margin % change if prices stay constant)
Convert scenario outcomes into decisions
A scenario model is only useful if it produces decision thresholds. Examples:
- “If payroll run-rate rises by >RM X/month, we must reduce OT hours by Y% or raise prices by Z%.”
- “If supervisor compression adjustment exceeds RM A/month, we will redesign team structures and reduce layers.”
- “If the effective date is early-year, we accelerate contract repricing and tighten working capital.”
This turns uncertainty into a set of prepared moves, rather than reactive payroll fixes.
How do you calculate fully-loaded labour cost correctly (wages, OT, allowances, EPF/SOCSO)?
This is where many budgets fail: they model the wage floor, but not the payroll mechanics.
Step-by-step costing for each role group
For each role group (e.g., production operator, driver, retail associate, junior admin, supervisor):
1. Baseline monthly pay
- Basic wage
- Fixed allowances (decide: keep constant or adjust?)
2. Overtime and premiums (expected value)
- Use trailing 3–6 months to estimate average OT hours and premium mix.
- Run a second version assuming OT governance improves (e.g., -10% OT hours) to quantify savings potential.
3. Employer statutory contributions
- Add employer-side contributions applicable to your workforce (commonly KWSP/EPF and PERKESO/SOCSO, and others where applicable).
- Ensure the calculation method aligns with your payroll setup; small configuration errors create big scenario errors.
4. Total monthly fully-loaded cost
- Sum of the above.
A practical compression-aware formula
When the floor rises, the “next band up” often expects an adjustment. Model compression explicitly:
- Compression adjustment pool (RM) =
- (# of near-floor employees in Band 2 × assumed adjustment amount)
- + (supervisors × assumed differential you want to preserve)
A simple policy is enough for budgeting:
- Preserve a minimum differential between role bands (e.g., supervisors must remain at least RM X above operators, or at least Y% above).
Don’t forget the “OT multiplier trap”
If your operation depends on OT to hit demand, wage increases can compound:
- Higher base wage → higher OT rate → higher OT cost → managers rely more on OT to avoid hiring → costs rise further.
Your model should show two numbers side-by-side:
- Scenario cost impact with current OT intensity
- Scenario cost impact with improved scheduling/OT controls
That comparison is the business case for operational change.
How can you quantify salary compression risk for supervisors and executives—before it becomes a resignation problem?
Compression is usually not a “people issue” until a capable supervisor leaves, a team destabilises, and your defect rate or customer SLA drops.
Map pay bands and identify where the pressure will appear
Create a simple band map:
- Band 1: entry / junior
- Band 2: skilled operator / senior clerk
- Band 3: team lead / supervisor
- Band 4: executive / manager
For each band, compute:
- Median pay
- 25th–75th percentile range
- Distance to the new floor (scenario-based)
Decide what you will defend: differential, not everyone’s percentage
A common mistake is to apply the same % increase across the board “for fairness.” That can be unaffordable.
Instead, choose one primary rule (budgetable and defensible):
- Differential rule: keep a clear step-up between levels that carry accountability (shift lead, cashier lead, line supervisor).
- Critical-skill rule: protect roles that are hard to replace or where errors are costly (QA, dispatch, key account ops).
- Tenure/retention rule: protect employees who anchor performance, not necessarily the longest tenure.
Put a number on retention risk
You don’t need a complex HR model. Use a cost-of-replacement estimate:
- Recruitment + onboarding + training time + expected productivity dip + error/quality risk
Then stress-test:
- If you do no supervisor adjustment, what is the plausible turnover cost?
- If you do a targeted adjustment, what is the payroll run-rate increase?
Management can then choose the cheaper risk.
Implementation guardrail: avoid ad-hoc promises
When wage headlines hit, line managers may start making informal promises. Set two controls:
- A single internal message: “We are reviewing pay bands and will confirm adjustments by [date].”
- A rule that all pay changes are modelled and approved through one owner (Finance/HR jointly).
If labour cost rises, what operational levers usually pay back fastest (without cutting corners on compliance)?
The best levers reduce cost per unit rather than simply reducing headcount. In many SMEs, quick wins come from controlling hours and redesigning work.
Overtime governance: treat OT like a purchased input
OT is often managed emotionally (“we need to ship today”). Put structure around it:
- OT approval matrix: who can approve and up to what limit
- Daily OT tracker by department: planned vs actual
- Root-cause codes: demand spike, absenteeism, machine downtime, rework, poor scheduling
- Weekly review: one action per root cause
Budget impact: reducing OT hours by even 5–15% can offset a meaningful portion of a wage-floor increase in OT-heavy operations.
Scheduling and shift design: match labour to demand, not habit
Common pattern: staffing is fixed, demand is variable. Options:
- Staggered start times to reduce idle time
- Better handover to reduce overlap waste
- Part-time peaks (where legitimately applicable)
- Cross-training to reduce bottlenecks
Measure: labour hours per unit shipped/served, by day and by shift.
Role redesign: remove “low-value time” before you buy automation
Before tools, redesign the workflow:
- Consolidate admin tasks into batches (e.g., invoicing windows)
- Standardise checklists to reduce rework
- Reduce handoffs (handoffs create waiting)
- Make one person accountable for end-to-end completion of a small process
Output-linked incentives: pay for throughput or quality, not just time
A wage floor increase doesn’t stop you from improving productivity incentives. Simple designs:
- Team-based output bonus with a quality gate
- Attendance + productivity hybrid (to avoid gaming)
- Skill-based pay steps for multi-skilled operators
Keep it measurable and auditable to avoid disputes.
Light automation/digitisation with quick ROI tests
Focus on “boring” automation:
- Time-and-attendance integration with payroll
- Simple production or service tracking (tablets, barcodes, job tickets)
- Basic routing/scheduling tools
ROI test (practical):
- Hours saved per week × fully-loaded hourly cost
- + error reduction value (credits, rework)
- − tool cost and implementation time
If payback is not clear within a reasonable period, pilot smaller or fix the process first.

How should you translate wage scenarios into pricing, margin protection, and contract decisions?
If you wait for the official announcement to adjust prices, you may lose a full quarter of margin—especially if contracts or customer price cycles are slow.
Start with a “labour-cost pass-through” view by product/service
For each product/service line, estimate:
- Labour cost per unit (or per service hour)
- Labour as % of selling price
- Gross margin sensitivity to wage scenarios
This highlights where a wage increase is existential (thin margins, high labour share) versus manageable.
Choose a pricing response that matches your customer reality
Not every business can “raise prices.” Consider four practical options:
- Direct price increase: simplest, but requires commercial justification.
- Packaging and mix: steer customers toward higher-margin SKUs or service tiers.
- Surcharge logic (where commercially feasible): a transparent adjustment tied to cost indices or wage changes.
- Service-level redesign: change what is included (delivery windows, response time tiers) to reduce labour intensity.
Renegotiate contracts early, using numbers not headlines
For B2B businesses, prepare a one-page pack:
- Scenario impact on labour cost per unit
- What you will do internally (OT control, productivity actions)
- What you are asking from the customer (price adjustment, revised SLAs, minimum order quantities)
If you have renewal windows, align your internal decision dates with them.
Margin protection is not only pricing—it’s also quotation discipline
Update quoting tools:
- Use fully-loaded labour cost, not basic wage
- Build in scenario buffers for long-lead projects
- Set an approval threshold for low-margin deals
A wage review becomes dangerous when sales keeps quoting last year’s labour assumptions.
What cash-flow stresses should you expect, and how do you build resilience into the payroll run-rate?
A wage increase is a recurring cash commitment. Even profitable businesses can get squeezed if working capital is tight.
Track the payroll run-rate like a weekly KPI
Build a simple dashboard:
- Total payroll paid (weekly or monthly)
- OT cost trend
- Employer statutory contributions trend
- Headcount and paid hours
- Payroll as % of revenue
The point is to see the new run-rate early and stop “drift.”
Model working-capital impact: payroll is immediate, collections are not
Ask two questions:
- If payroll rises by RM X/month, how many additional days of receivables does that effectively finance?
- Do your customer payment terms allow you to carry higher payroll without drawing down cash reserves?
If you have seasonal revenue, model the worst month, not the average month.
Use break-even headcount/hours analysis to guide staffing
For labour-intensive operations, compute:
- Break-even units or billable hours at each wage scenario
- Maximum affordable OT hours before you should hire (or redesign schedules)
This prevents the common failure mode: “we keep paying OT because hiring feels risky,” even though OT is now more expensive.
Practical control points that reduce surprises
- Align time-and-attendance cut-off with payroll cut-off (reduce adjustments)
- Tighten approval for allowances and ad-hoc payments
- Validate payroll configuration changes (EPF/SOCSO and pay elements) before the first run
Paul Hype Page & Co. often supports clients here as an implementation partner—reviewing payroll element setup, scenario modelling, and management reporting—so finance teams can run the new wage reality without firefighting each month.
What external signals and benchmarks should you watch (including Selangor wage policy signals) without turning this into guesswork?
You can’t budget responsibly based on rumours, but you can watch indicators that help you choose sensible scenario ranges.
Selangor wage policy signals: what to monitor operationally
Selangor often matters because it is a major labour market and can influence expectations. Rather than predicting policy, monitor:
- Wage expectations in hiring pipelines (offer acceptance rates, counteroffers)
- Competitor job postings and advertised ranges
- Turnover/absenteeism changes in Selangor sites vs other locations
If your Selangor operation faces tighter labour supply, compression and retention costs may arrive earlier than the formal wage floor.
Sector differences: don’t copy a generic “market increase”
Wage-floor effects vary by:
- OT intensity (manufacturing, logistics)
- Customer price rigidity (retail, F&B vs B2B services)
- Ability to redesign service levels (cleaning, security, support services)
Benchmark within your sector:
- Labour cost as % of revenue
- Typical supervisor-to-staff ratios
- Typical OT hours per head
Competitor benchmarking that doesn’t require perfect data
Use what you can access:
- Public job ads and hiring ranges
- Supplier and subcontractor rate changes
- Customer feedback about competitor price moves
Then keep your model flexible: update assumptions quarterly rather than waiting for year-end.
How should foreign investors and expanding companies assess Malaysia’s cost-competitiveness versus neighbours?
For investors, the minimum wage review is not only a payroll line—it affects location strategy, scaling speed, and which work you place in Malaysia.
Build a location sensitivity model, not a single “Malaysia is cheaper” assumption
Compare scenarios across locations using the same structure:
- Fully-loaded labour cost per productive hour
- Expected productivity level (not just wage rate)
- Hiring lead time and turnover risk
- Compliance and payroll administration complexity
- FX and inflation sensitivity (where relevant to your reporting currency)
Malaysia may remain competitive even with higher wages if productivity and stability are strong for your operation.
Decide which work should stay human-led, and which should be redesigned
Rising wage floors tend to accelerate three shifts:
- Move low-complexity, high-volume tasks toward basic automation
- Increase multi-skilling to reduce headcount per line/shift
- Redesign customer delivery promises to reduce labour spikes
Investors should test whether the planned operating model is still valid under the downside scenario.
Expansion timing: avoid locking cost assumptions into long contracts
If you are negotiating:
- Long-term customer pricing
- Outsourcing contracts
- Large hiring ramps
…run sensitivity checks first. If the downside scenario breaks the case, build protective clauses or stage the ramp.
This is where an advisory partner can help: align scenario budgeting, payroll setup, and management reporting so that the Malaysia plan remains investable under multiple wage outcomes.
What should your 60–90 day action plan look like before 2027 budgets are finalised?
The best preparation is not a policy summary—it’s a management rhythm that converts scenarios into executed changes.
Weeks 1–2: Build the baseline model and choose scenario ranges
- Clean workforce and payroll element data
- Calculate fully-loaded cost per role group
- Define base/upside/downside assumptions (wage outcome + timing + compression)
- Produce the first dashboard: run-rate, cost/hour, margin sensitivity
Owner: Finance with HR and Operations input.
Weeks 3–6: Identify offset levers and lock OT governance
- OT approval matrix and tracking
- Scheduling changes for top 1–2 departments
- Identify top 3 process pain points causing OT/rework
- Quick ROI pilots for digitisation (time capture, job tracking)
Owner: Operations, with Finance measuring savings.
Weeks 7–10: Translate into pricing and contract moves
- Update cost assumptions in quoting tools
- Prepare customer renegotiation packs for sensitive accounts
- Decide on price/mix actions by product line
- Align sales incentives with margin protection (not only revenue)
Owner: Commercial lead with Finance support.
Weeks 11–13: Finalise pay-band approach and controls
- Compression policy (targeted, band-based)
- Implementation timeline (communication + payroll configuration)
- Control rules for ad-hoc allowances and manager promises
- Monitoring cadence (monthly pay-band review, quarterly scenario refresh)
Owner: HR + Finance jointly.
This sequencing keeps you ahead of the announcement, without making premature commitments.
Conclusion
A minimum wage review is manageable when you treat it as a scenario-driven budgeting exercise, not a last-minute payroll adjustment. Build three cases (including effective-date timing), calculate the fully-loaded labour cost (wages, OT, allowances, employer EPF/SOCSO and other applicable items), and quantify compression so you can choose a deliberate pay-band response. Then convert the numbers into actions: tighten overtime governance, redesign schedules and roles, test small automation with clear ROI, and prepare pricing/contract moves before 2027 budgets and customer renewals lock in. If you need an external partner to pressure-test assumptions and turn scenarios into payroll-ready implementation and management reporting, Paul Hype Page & Co. can support the modelling, controls, and execution—so the announcement becomes an operational update, not a business shock.
FAQs
Start with fully-loaded cost per productive hour by role group, using how you actually pay people (basic wage, allowances, typical OT, and employer EPF/SOCSO), then roll it up to monthly run-rate and unit cost.
Map pay bands and choose a defendable rule—such as maintaining a minimum differential for accountability roles or protecting critical-skill positions—then budget a targeted compression adjustment pool rather than a uniform % increase.
Estimate average OT hours and premium mix from the last 3–6 months, then run two versions side-by-side: current OT intensity and an improved-control case (e.g., fewer OT hours) to show the “OT multiplier” effect.
Keep three drivers adjustable: wage floor outcome (low/medium/high), effective-date timing (early vs mid-year), and coverage/compression (% below the floor plus near-floor and supervisor adjustments), then compare run-rate, RM/hour, and margin sensitivity.
Tighten OT governance (approval and tracking), redesign schedules to match demand, remove low-value work through role/process redesign, use output-linked incentives with measurable gates, and pilot light digitisation where hours saved can be valued against fully-loaded hourly cost.
Related Business Articles


Share This Story, Choose Your Platform!